Geospatial Supply Chain Mapping
Observe your global footprint with high-contrast heatmaps showing real-time distribution efficiency.

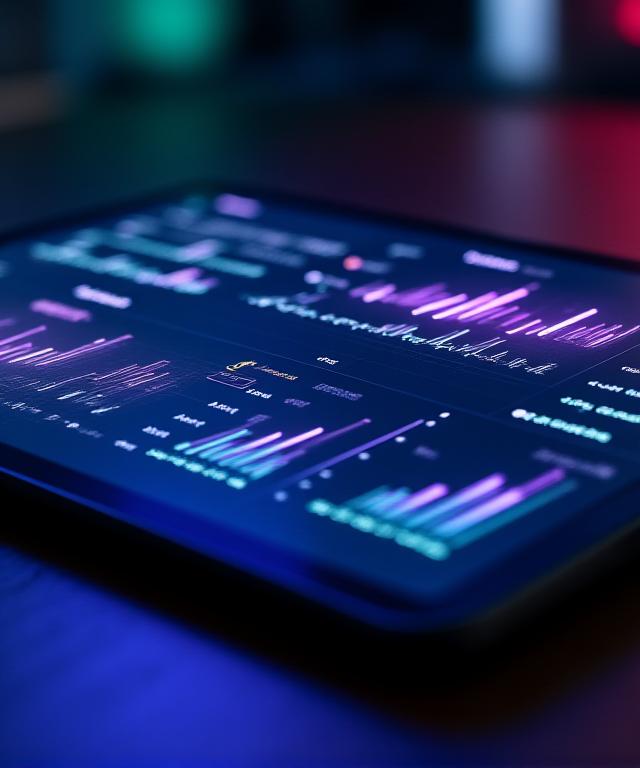
Numbers carry stories, but they're often buried in spreadsheets. We don't just build charts; we craft visual narratives that reveal the pulse of your Cayman business in real-time.
Ever wondered why certain metrics dip on Tuesdays? Our scatter plots and funnel analyses don't just show you what happened—they show you why it happened. We're committed to clarity over clutter.
Observe your global footprint with high-contrast heatmaps showing real-time distribution efficiency.
Identify where your revenue leaks are happening.
Link disparate data points instantly.
Why settle for static snapshots when you can have a flowing data ecosystem? TundraVex Systems utilizes low-latency rendering engines to ensure your dashboards always reflect the current second.
Our underlying architecture handles millions of events per hour without breaking a sweat. No lag. No downtime. Just speed.
/* TODO: optimize WebGL shaders for mobile browsers */Vector-based visualizations that remain crisp on everything from a mobile phone to a 4K boardroom display.